
Describe the overall Challenge you're striving for, in a meaningful way. What cool situation do you want to have 6 months to 3 years from now? Future-State Mapping is a useful tool here.

Study the facts and data of where you are now. You’re trying to see, sketch, measure and understand the current pattern, as an input to Step 3.

Now describe where you want to be next on the way to your Challenge. It will usually take a series of Target Conditions to reach your Challenge goal. Be sure the Target Condition is measureable in some way, and has a specified achieve-by date between one week and three months out.

You can’t foresee the exact path to the Target Condition. The obstacles you encounter show you what you need to work on to get there. Find the path by conducting experiments daily, using the Experimenting Record and asking the Five Coaching Kata Questions after each experiment.
What is the target condition?
What is the actual condition now?
What obstacles do you think are preventing you from reaching the target condition? Which one are you addressing now?
What is your Next Step? (next PDCA/experiment) What do you expect?
When can we go and see what we have learned from taking that step?
 d
d
Decreasing the MCT in processes will have an impact on on-time performance, quality, costs, productivity and market share, profitability and space and office productivity. Therefore, to clarify whether improvements have been achieved, it is important to examine the MCT of the process flow before and after the modifications.
The aim is to make the MCT as short as possible.
The first step is to develop a MCT map of the current situation. This map provides a visual overview of the MCT spent on a product or service. An example of a MCT map is shown below.

The gray
space (touch time): The time spent on developing a product or
service, by adding value for the customer.
The white space (elapsed time): The remaining time when no value is added to the product or
service.
The map represent an overview of the greatest possible improvements. The traditional cost-reduction or efficiency-improvement approaches focuses on improvements in the touch time. MCT looks time differently, it focuses on reducing the larger proportion of the total MCT: the elapsed time. This will have a bigger impact on the lead time than focusing on the small fraction (gray space) where value is already added.
It is more important to quantify the white space instead of the gray space. Moreover, all actions executed should contribute to reduce the white space.
Both Scrum
and Kanban use visual boards to show available work, work-in-process, and
completed work (often under the headings “To-do”, “Doing”, and “Done”). Scrum
and Kanban encourage and promote team-based problem solving throughout the completion
of prioritized tasks, and can be effectively adopted in both software- and
hardware development, as well as in project-based production environments, such
as in ETO manufacturing.
The aim of SMED is to reduce inventories by retrofitting the machine to a new production process without disturbing the production flow. The final goal can be achieved if a machine or production line can be converted within a production cycle so that a one-piece flow or even a mixed-model one-piece flow can be implemented even with the most diverse products Can In this case, the stocks in the line are also equal to zero. The main objective is to reduce waste, viz., time wasting, by applying the SMED technique.
The process was developed by Shigeo Shingō, who as an external consultant was instrumental in the development of the Toyota production system (TPS). Implementation: In several iterative steps the set-up time is only improved by organizational measures and later by technical measures. To minimize the cost, it is important that the steps are completed in the given order. The experience is that each step results in a reduction of the set-up time from 50 to 60% (in relation to the previous step). Major investments are made at a very late stage, if at all.
The main objective is to reduce waste, viz., time wasting, by applying the SMED technique.Normally the SMED-Method is cobined with the Kaizen Approach to have a more agile, efficient waste reduction.
There are ten important problems that Kanban helps to solve:
- Lack of organisation
- Missed deadlines
- Communication slip-ups
- Overwhelmed with information
- Status information
- Inconsistency
- Not agile
- Limited acess
- Rigid layout
- Productivity
Visualize the workflow for all participants after splitting processes in parts. With the help of kanban boards the stations of a process can be visualized. Each board has a specific capacity. Therefore only a specific number of task can be done simultaneously. The tasks, features, user and stories of a process can be written on a kanban card. A single card is moving between the different kanban boards. This creates a pull-system, where a station picks up work from another station.
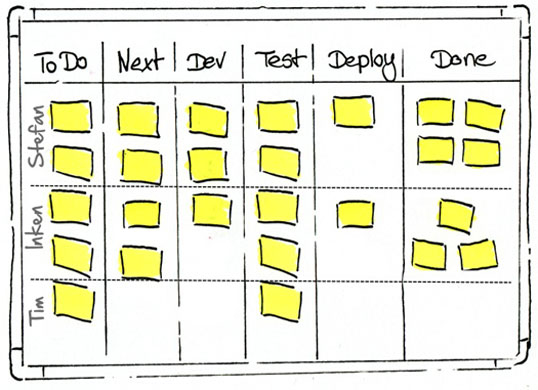
Every member of a kanban process can measure queue times, cycle times and throughput in ordert o organize workload at the stations nearly perfect.
There are six generally accepted rules for kanban:
1. Downstream processes may only withdraw items in the precise amounts specified on the kanban.
2. Upstream processes may only send items downstream in the precise amounts and sequencesspecified by the kanban.
3. No items are made or moved without a kanban.
4. A kanban must accompany each item at all times.
5. Defects and incorrect amounts are never sent to the next downstream process.
6. The number of kanbans should be monitored carefully to reveal problems and opportunities for improvement.
placeholder
placeholder
placeholder
Organisations should be structured differently to be able to respond quickly in a low-volume environment with customized products. According to QRM, it is important to change from a functional to a cellular structure.
Typical
office activities include request for quotations (RFQ) processing, order
processing and new product design and development. There are several
departments involved in these processes, such as sales, customer service,
engineering, purchasing, scheduling and so on.
Although these operations might take half of the total lead time, accounts for a quarter or more of the total costs and impacts the overall market share, not rarely these office operations are neglected as improvement opportunities in companies.
In addition, look at the Response Time Spiral by Rajan Suri (source: R. Suri, It’s About Time, 2010). This spiral shows why long lead times result in even longer lead times.
In the traditional structure of office operations, we see a lot of departments. Many functional departments in the office operations result in lots of handoffs to process each job. Besides, different orders go through the departments differently.
In order to reduce the lead time, it is necessary to break down functional walls and create a team that can process jobs through multiple functional steps. This cellular organisation might look like the figure below.

You see different functions from different departments are combined into cells and therefore less handoffs take place. A typical result of an office operation is an quotation to the customer or a production order, including all information needed to fabricate the product.
Quick Response Office Cell (Q-ROC) is a multifunctional, cross-trained team located in close proximity, dedicated to all office activities that belong to a FTMS or product family, with ownership of all operations and commitment to lead time reduction. Different functions are combined in the cell and the team should both have the experience and authority to complete the processing of jobs entering the Q-ROC.
Team members should be provided with expertise via cross-training. As included within the definition, team members should be physically located together in one area. Eventually, cells are created which are as independent as possible in relation to other cells. But the team members have a shared responsibility which makes them dependent of each other.
It is important to overcome some typical challenges. First, There should be enough support from top management. Therefore, also top management should be educated on the main principles of QRM. Then, Teamwork, cross-functionality and ownership cannot compensate for insufficient capacity. So, capacity should be planned properly. Finally, measuring the success of the Q-ROC should be time-based, not efficiency based.
With value stream mapping, you are mapping the flow from raw material to the customer, including all value- and non-value-added processes. Mapping this flow highlights many improvement opportunities. However, value stream mapping is originally set up for high- and medium-volume environments. Mapping a product that is not made very often may sound illogical.
The main reason of value stream mapping is to improve the company processes and activities. So, before you even start with any mapping tool, you already described the main organizational problem and goal, and you decided that value stream mapping helps you to solve the problem. Thereafter, the first step is to understand the current situation of the organization. What activities belong to the overall process? Which bottlenecks do you see in the process and which one affects your main problem? To give an answer on these questions, you have to focus on the flow and the value of the entire stream. With value stream mapping you see obstacles and opportunities to improve the process flow.
Having a clear view of the obstacles and opportunities to improve the process flow in an organization which operates in a high mix, low volume environment.
A couple of suggestions for a future state map in high mix, low volume environments are to put in pull systems wherever possible (focusing on expensive inventories). Besides, work with customers that want to change their large quantity orders into smaller orders and therefore split delivery days (this will help to work closer to one-piece flows for example). And finally, focus on long changeover times, since this might happen more often in a high mix, low-volume environment. These are only three suggestions, and of course there are more. However, it is not possible to clarify all the differences between high volume and low volume environment.
A couple of strategies are recommended to use for value stream mapping in low-volume departments or businesses. First of all, it is important to decide on what you are going to base your value stream map, e.g. based on the following five:
1. Product families
2. High running parts. So, which parts (or products) go through production most often? Or said differently, high volume parts in the low volume environment.
3. A general value stream map for the basic processes you have, and a few total product cycle time lines (TPCT) for some of the higher volume parts.
4. Individual value stream maps for each high-value part number. In this case, we assume that each runner follows a different path or uses different materials.
5. Individual maps for critical components (or subassemblies).
Second, when you start mapping the future state
of value streams in high mix, low volume environments, it is important to focus
on the basic differences between high volume and low volume environments, such
as: shared processes – partly utilized processes, varying type of orders, size
of orders, the inability to calculate and plan based on takt time and so on.
There is a specific symbol that can be used for low-volume environments. It is
the symbol for shared processes, you see below.

This symbol is especially useful for low volume operations since you often have a process or machine that is shared among different product. When this is the case, it helps to show the percentage of capacity utilized by the value stream that you are mapping, as well as the total current percentage the process or machine is utilized by all products. These data clarifies if it is a bottleneck process/ machine. Imagine when the total utilization is 90% and the process or machine is utilized by many different products or value streams. This result in a many challenges such as planning and control. Therefore, visual management at shared processes and machines is critical to understand its status.
Essentially a form of process map, it contains “the Golden Rules” which consist of the following 5 factors:
- Activities performed by all participants
- All documents/media used for communication
- Communication
- Time-analysis
- Identified problems
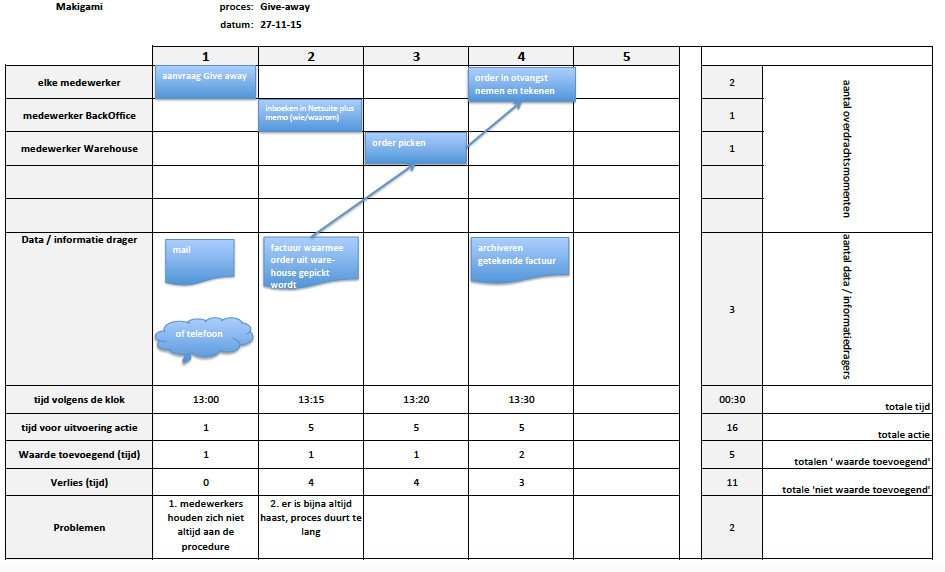
As a process map, Makigami focuses on visualising aspects of the organisation which are not physical or directly visible. The Makigami Process Map also can be used to improve the investigated process by designing a future state map after taking away the identified losses.
This process maps shows:
- Wrong information
- Waiting for data
- Check data
- Rework
- Storing
- Moving
At the end makigami should give an overview about the non visable processes of the organisation.
Makigami contains 3 phases:
- What is the actual condition now?
- What is the target condition?
- What steps have to be done to reach the target condition?

In order to analyze the current situation of organizational processes, you need to collect data about jobs, their routings, arrival and departure times, et cetera. In situations when jobs (or parts) wait in staging areas, or warehouses, or at people’s desks in office, there may not be accurate data on these times. But how do you get this data? Therefore, it is our challenge to understand the basic relationship between the time of a job (the time it takes to produce a product, or work on an order), the time the product or order spends in a queue and the throughput (or the amount of products or orders that are made in a production system).
In the figure below, you see a production process. The total process consists of a processing job and a queue.

The processing job transforms input to output, for instance the assembly of parts into an total product or the treatment of a patient or something else you can think of. The number of parts in the queue depends on the time it takes to process the product and how much products enter the total process in a certain amount of time. The quicker the products enter the system, or when it takes a longer time to process the jobs, there is need for this queue to store products until processing.
Little’s law is a tool that can help with determining how long job/parts have been waiting, when timestamp data is not readily available. You want to know the relation between the times that it takes to process the job, the waiting time in the queue and the number of products entering and leaving the system.
How does Little’s Law work? There is some information you need to perform a calculation. First of all, there is the processing time or job time. This is the time it takes to do the work on one single products. Second, you have the queueing time. This is the time one single product waits in a queue. Then, there is the total throughput time (THT). This is the overall time it takes for one product to go through the queue and the processing job. Furthermore, there is the work in progress (WIP). This is the number of items in the system. Lastly, the throughput (TH). This is the number of products going through the system.
Combining these information:
The
number of items in the system (WIP) equals the number of products going through
the system (TH), multiplied by the total time it takes (THT) (see the figure
below).

How to control the material flow on the shop floor in a context of low volume or customized products?
Lean Manufacturing is about the elimination of waste, such as inventory. Therefore, a lot of organizations invest in streamlining the production process. By making use of Kanban, they try to control the flow of orders/products. A Kanban card is a material signal. When the inventory of this product needs to be refilled, a signal is sent to the department which is responsible for its supply. This strategy works fine when you have a relative low amount of product variants. However, when your organization makes high variety of products in different volumes, a material signal does not work.
To control material flow on the shop floor, we need a system that works well in the context of low-volume or customized products. Additionally, it should work in the context of a cellular structure.
POLCA is designed to meet these needs specifically. In comparison to Kanban cards, POLCA cards are capacity signals. These signals does not indicate the need of a specific product or material, but it indicates the availability of capacity to work on any type of product or material.
First, you should identify the POLCA loops.
1. Reduce variability in products
2. Create an overview of the inter-cell traffic
3. Create a From-To-Table
4. Design the actual loops
Then, you should calculate the number of POLCA cards needed. Therefore you use the following formula: (The number of POLCA cards) equals (the sum of the lead time of cell A and the lead time of cell B) times (the number of jobs exchanged from cell A to cell B during the planning period) divided by (the planning period D). See figure below.

Third, when necessary, you could add a POLCA safety card. A POLCA safety card can be used in case of disruptions in supply by external suppliers or non POLCA cells. Safety cards are temporary solution for unplanned events. Safety cards are typically authorized and circulated by one individual on the shop floor (production manager, scheduler, etc). If the disruption is gone, this individual takes the card out of the system again.
Job-shop environments are confronted with the challenge of lack of support for production planning and control. ERP packages provide planning solutions that are not suitable for job shop environments as they do not focus on capacity planning and control. Older card-based control systems such as Kanban and POLCA are suited for repetitive production environments, but not for high-customization low-volume environments such as job-shops.
Production planning does not consider workloads and as a result, throughput times are unpredictable. Additionally, reliability for promised delivery dates is low. Workloads on different work stations are unbalanced.
- Workload and throughput times are kept within their planned levels
- Balancing of workloads is enabled through the use of a centralized planning board
- Allows for predictable throughput times, increasing reliability of promised delivery dates
- Relative urgency of orders is taken into account by the sequence of orders in the backlog list and the procedure for selecting orders to be released
COBACABANA is an acronym that stands for Control of Balance by Card-Based Navigation. Martin J. Land proposed COBACABANA in 2009, as a card-based method that is based on the concept of workload control (WLC); simple to implement; more suited for job shop environments, i.e., production environments with high routing mix, as compared to Kanban that is essentially dedicated to repetitive production environments.
2.
Utilisation of the process/machine
3.
Variation in the process or arrival of jobs
The principle behind Kingman’s equation to approximate the
mean waiting time can be expressed as:
Mean waiting
time = (Processing time of the Job) X (Effect of Utilisation of the Processes/Machinery)
X (Effects of Variation)